Business task
This analysis focuses on the accurate prorating of revenue and expense data from different SaaS products and cost sources—whether billed on a monthly basis or on an hourly basis—into a standardized Monthly Revenue and Profit view. By uniformly distributing variable-period flows into calendar months, the goal is to create a reliable profitability dashboard that reflects operational performance across time regardless of billing periodicity.
This approach enables founders, finance teams, and analysts to make more informed business decisions based on normalized monthly performance, even when real income and costs follow irregular or custom schedules.
Data sources used
This project draws from operational and financial data tracked in a structured Google Sheets document:
- SaaS revenue and contract data (monthly and hourly billing)
- Regular business expenses
The data is updated by operators manually and automatically processed through Google Apps Script (JavaScript), which ensures reproducibility and quick updates. The system supports flows with:
- Defined start and end dates
- Optional hourly rates
- One-off income and expenses
All data is reviewed for accuracy at input and validated by script logic to avoid double-counting and misalignment.
Tools used
For this project, I used Google Sheets and Google Apps Script (JavaScript).
Manipulation of data
The script employs custom JavaScript functions within Google Apps Script to distribute financial flows into corresponding months. Key preprocessing includes:
- Calculating the number of billed days per contract
- Adjusting for edge cases (e.g., partial months, open-ended contracts)
- Handling both “Hourly” and “Monthly” billing modes by normalizing to a daily rate
- Using fixed average month length (
30.417 days) for consistent prorating across calendar months
Here’s a simplified view of the main formulaic logic:
If full-time:
  Daily Rate = Monthly Salary / 30.417
Else if hourly:
  Daily Rate = Total Hourly Revenue / Billed Days

For each month:
  Revenue = Daily Rate × Active Days in That Month
Analysis
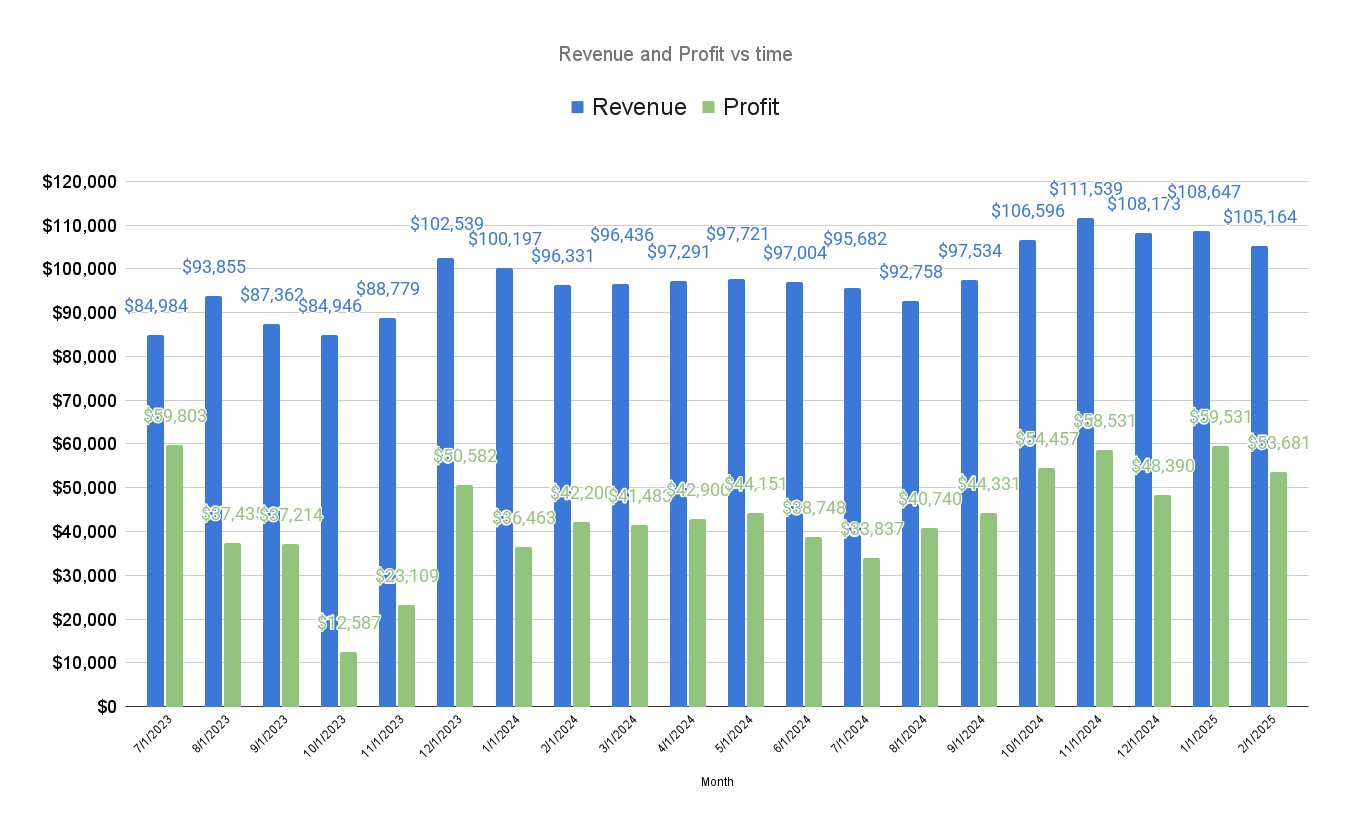
The script-generated table provides a consistent timeline of monthly performance. Key observations from initial use:
- Monthly contracts tend to span multiple months, showing consistent monthly revenue streams, but drop off sharply at contract end.
- Hourly contracts create more variable month-to-month revenue.
This method ensures that short-term performance shocks (like sudden contract ends) are immediately visible in monthly summaries, supporting proactive decision-making.
Further exploration
To extend this analysis, potential improvements could include:
- Creating cumulative profit dashboards or year-to-date summaries
- Incorporating forecasting models based on active contracts and churn
Insights
This project demonstrates how JavaScript automation in Google Sheets can transform inconsistent financial input into clear, actionable monthly insights. Core takeaways:
- Prorating revenue and costs accurately allows consistent performance measurement across time
- Monthly vs hourly models must be handled differently to avoid misrepresentation
- Automation reduces manual error and makes dashboards easy to update and scale
By leveraging smart scripting in a spreadsheet environment, teams can bridge the gap between raw business data and strategic insight, without needing external BI tools.